44 years of inflation adjusted stock prices in India
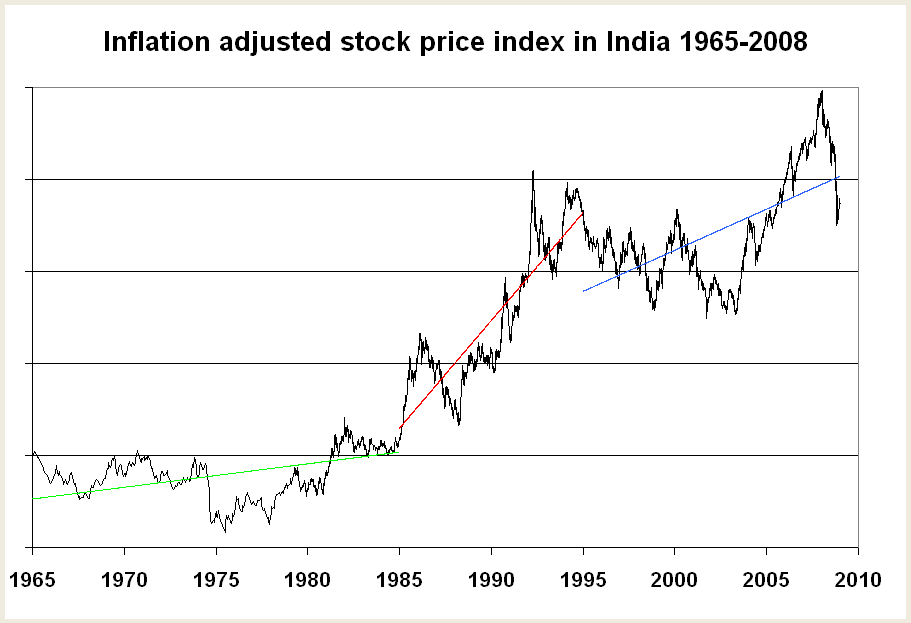
Above is a plot that I have put together of the real (inflation adjusted) stock price index in India from 1965 to 2008. The plot is on a log scale – each horizontal grid line represents a doubling of the real stock price.
I have divided the sample into three periods and it is obvious that all the action happens in the middle period from 1985 to 1994. On a point to point basis, practically the entire increase in real stock prices happens during this period.
The compound annual growth rates on point to point basis are: 0.57% (1965-1984), 18.95%(1985-1994) and 0.33% (1995-2008). Since point to point comparisons are misleading, I have also plotted exponential trend lines (straight lines on the log scale plot) for each of the three time periods. These trend lines also tell the same story of huge growth during 1985-1994 and tepid growth before and after. The compound annual growth rates from the trend lines are: 1.78% (1965-1984), 17.62%(1985-1994) and 6.39% (1995-2008).
This is not really surprising. Most of the movement towards a free market economy took place during the Rajiv Gandhi prime minister-ship in the mid/late 1980s and the Manmohan Singh finance minister-ship during the early 1990s. Since then, reforms have been at a glacial pace. India learned the wrong lessons from the Asian Crisis and seems to be learning the wrong ones again from the current crisis.
Notes on the data
- The nominal stock price index is obtained by chaining together the Economic Times stock price index (hand collected at fortnightly intervals from 1965 to 1979), the BSE Sensex from 1979 to 1990, and S&P CNX Nifty thereafter.
- The price index chains together various series of the Consumer Price Index (Urban Non Manual Employees) and a small initial period (1965-1968) of the Consumer Price Index (Industrial Workers). Since the CPI is not yet available for November and December 2008, the October 2008 index level is carried forward to this period as well.
- The real index obtained by dividing the nominal stock price index by the Consumer Price Index was re-based to equal 2 on January 1, 1965. The log scale plot uses logarithms to the base 2 to facilitate ease of interpretation. The lowest point of the real index is 1.12 in July 1975 and the highest point is 31.18 in January 2008.
Posted at 12:37 pm IST on Sun, 4 Jan 2009 permanent link
Categories: CAPM, equity markets, financial history
Comments