Does Gamestop have a negative beta?
TL;DR: No!
The internet is a wonderful place: it knows that I have posted on Zoom’s negative beta and it also knows that I have posted on Gamestop and r/wallstreetbets. So it quite correctly concludes that I would have some interest in whether Gamestop has a negative beta. Yesterday, I received a number of comments on my blog on this question and my blog post also got referenced at r/GME. According to r/GME, several commercial sources (Bloomberg, Financial Times, Nasdaq) that provide beta estimates are reporting negative betas for Gamestop (GME).
I began by running an ordinary least squares (OLS) regression of GME returns on the S&P 500 returns. Using data from the beginning of the year till March 16, I obtained a large negative beta which is statistically significant at the 1% level. (If you wish to replicate the following results, you can download the data and the R code from my website).
             Estimate Std. Error t value Pr(>|t|)
beta        -10.54182    3.84200  -2.744  0.00851
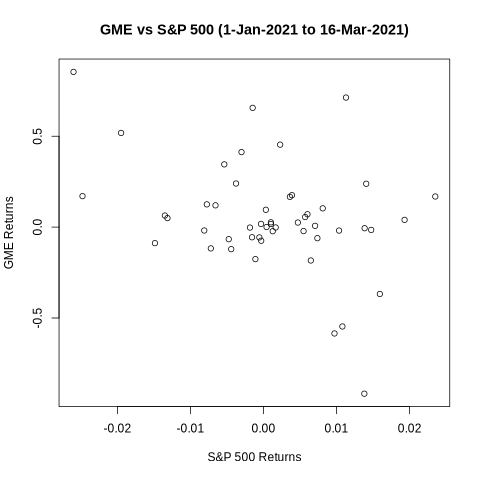
The next step is to look at the scatter plot below which shows points all over the space, but does give a visual impression of a negative slope. But if one looks more closely, it is apparent that the visual impression is due to the two extreme points: one point at the top left corner showing that GME’s biggest positive return this year came on a day that the market was down, and the other point towards the bottom right showing that GME’s biggest negative return came on a day that the market was up. These two extreme points stand out in the plot and the human eye joins them to get a negative slope. If you block these two dots with your fingers and look at the plot again, you will see a flat line.
Like the human eye, least squares regression is also quite sensitive to extreme observations, and that might contaminate the OLS estimate. So, I ran the regression again after dropping these two dates (January 27, 2021 and February 2, 2021). The beta is no longer statistically significant at even the 10% level. While the point estimate is hugely negative (-5), its standard error is of the same order.
             Estimate Std. Error t value Pr(>|t|)
beta        -4.97122    3.62363  -1.372    0.177
However, dropping two observations arbitrarily is not a proper way to answer the question. So I ran the regression again on the full data (without dropping any observations), but using statistical methods that are less sensitive to outliers. The simplest and perhaps best way is to use least absolute deviation (LAD) estimation which minimizes the absolute values of the errors instead of minimizing the squared errors (squaring emphasizes large values and therefore gives undue influence to the outliers). The beta is now even less statistically significant: the point estimate has come down and the standard error has gone up.
             Estimate Std.Error Z value p-value
beta        -2.7999   5.0462   -0.5548  0.5790
Another alternative is to retain least squares but use a robust regression that limits the influence of outliers. Using the bisquare weighting method of robust regression, provides an even smaller estimate of beta that is again not statistically significant.
            Value   Std. Error t value
beta        -1.5378  2.3029    -0.6678
Commercial beta providers use a standard statistical procedure on thousands of stocks and have neither the incentive nor the resources to think carefully about the specifics of any situation. Fortunately, each of us now has the resources to adopt a DIY approach when something appears amiss. Data is freely available on the internet, and R is a fantastic open source programming language with packages for almost any statistical procedure that we might want to use.
Posted at 2:47 pm IST on Wed, 17 Mar 2021 permanent link
Categories: CAPM, investment, market efficiency
Comments